Sales and Profits – Whose Got Them?
Sales and Profits – Whose Got Them?
March 20, 2026
Sales and Profits – Whose Got Them?
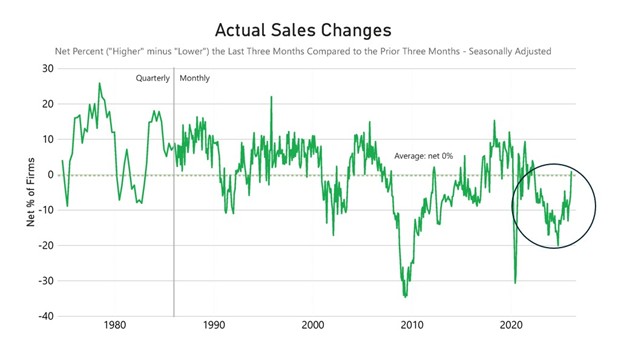
The economy is plodding along, with positive growth, but very slow. The closer one walks to the edge of zero growth environment, the higher the probability that one might fall off. Inflation is in the 2% range but on the high end, well above the 2% goal. Oil markets are now driving inflation developments. Energy costs are in everything, and if the barrel price of oil rises (or even fails to fall), prices will rise to cover those costs. The US produces more oil than it consumes, but oil prices are set in a global market, not just in Texas and Alaska. A resurgence of price inflation will cool down consumer spending, which is already experiencing slow sales (Chart 1).
Table 1 shows the incidence of positive and negative (“no change” not shown) sales and profits growth. Most industries reported similar levels of higher sales, ranging from 21% to 23%. Exceptions included manufacturing, transportation, and non-professional services. The leading industries experiencing sales declines were the wholesale trades, agriculture, finance, and transportation. The data presents a very mixed picture: industries reporting the highest percent of increased sales also show high percentages reporting lower sales trends. Overall, for every two firms reporting higher sales, three firms reported declines.
Table 1: Earnings and Profits. NFIB Small Business Economic Trends
| Industry | Earnings (%) | Sales (%) |
|---|---|---|
|
Industry
Construction
|
Earnings (%)
Higher: 13 / Lower: 31
|
Sales (%)
Higher: 22 / Lower: 26
|
|
Industry
Manufacturing
|
Earnings (%)
Higher: 13 / Lower: 38
|
Sales (%)
Higher: 17 / Lower: 28
|
|
Industry
Transportation
|
Earnings (%)
Higher: 9 / Lower: 37
|
Sales (%)
Higher: 12 / Lower: 31
|
|
Industry
Wholesale
|
Earnings (%)
Higher: 9 / Lower: 46
|
Sales (%)
Higher: 23 / Lower: 33
|
|
Industry
Retail
|
Earnings (%)
Higher: 13 / Lower: 43
|
Sales (%)
Higher: 23 / Lower: 29
|
|
Industry
Agriculture
|
Earnings (%)
Higher: 16 / Lower: 36
|
Sales (%)
Higher: 22 / Lower: 35
|
|
Industry
Finance, Real Est.
|
Earnings (%)
Higher: 17 / Lower: 37
|
Sales (%)
Higher: 21 / Lower: 32
|
|
Industry
Non-prof. services
|
Earnings (%)
Higher: 16 / Lower: 31
|
Sales (%)
Higher: 15 / Lower: 19
|
|
Industry
Professional services
|
Earnings (%)
Higher: 23 / Lower: 40
|
Sales (%)
Higher: 23 / Lower: 21
|
|
Industry
All firms
|
Earnings (%)
Higher: 14 / Lower: 38
|
Sales (%)
Higher: 19 / Lower: 30
|
*Sample size of 959 firms
Reports of declining earnings outnumber reports of gains by about four to one, which is not a happy balance. This is partly due to the weak sales environment. Higher earnings were most frequently reported by firms in the professional services industry. Overall, firms in the finance, non-professional services, and agriculture industries outperformed those in the production sector.
Looking at sales reports over time, consumers have become less willing to spend their money at small businesses in recent years. Weak profit growth impairs expansion and investment. Additionally, in a competitive environment, the opportunity to raise prices to boost earnings is limited. If spending patterns shift toward goods and services that small businesses can’t provide, our small business sector will shrink.
Chart 1: Actual Sales Changes. NFIB Small Business Economic Trends.
NFIB is a member-driven organization advocating on behalf of small and independent businesses nationwide.
Related Articles